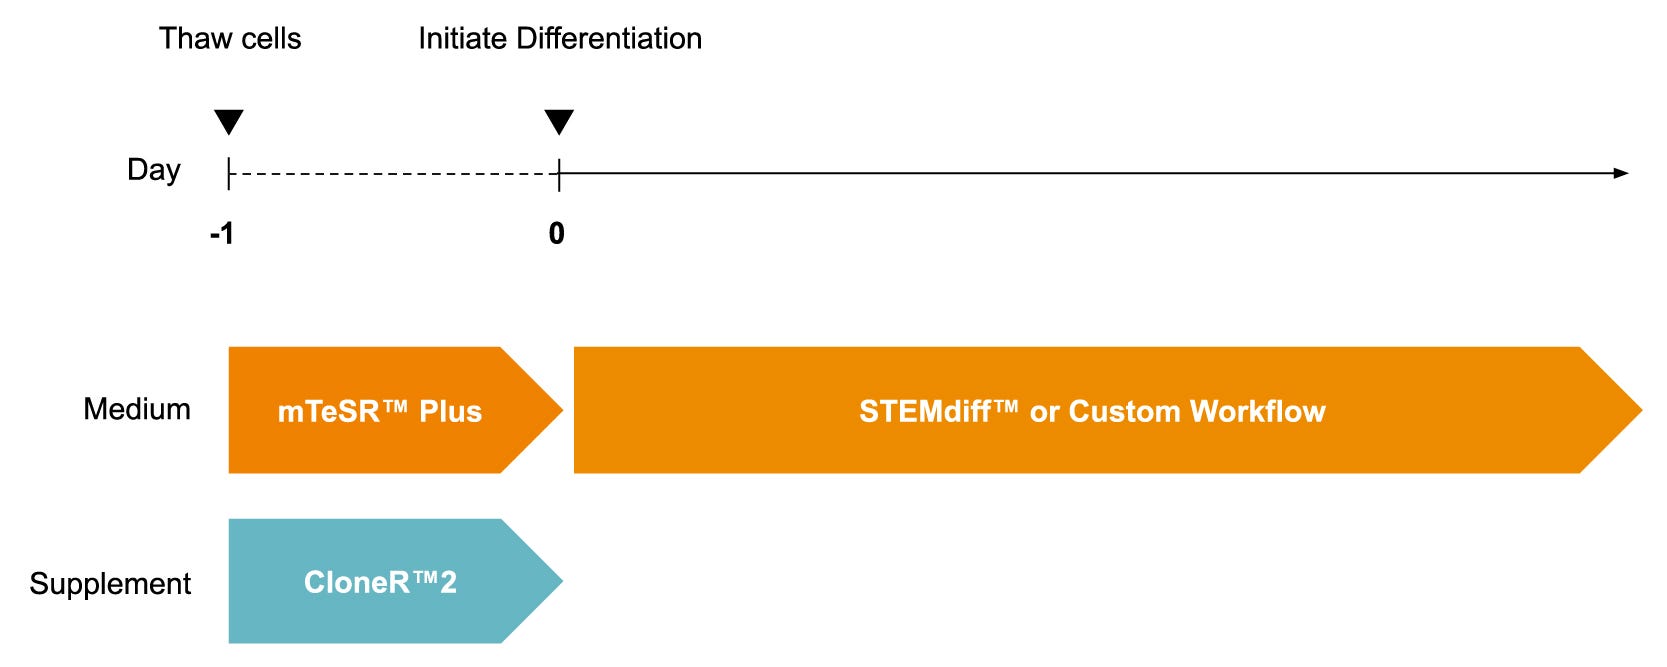
Figure 1. Schematic for a Generalized Monolayer Protocol to Thaw and Culture iPSCdirect™ for iPSC-Based Monolayer Workflows
iPSCdirect™ cells can be thawed and plated into mTeSR™ Plus (Catalog #100-0276) supplemented with CloneR™2 (Catalog #100-0691) and incubated overnight according to product instructions. Recommendations for seeding densities to reach the desired confluency at 24 hours may be found in the Product Information Sheet. After 24 hours, cells are ready for STEMdiff™ or customized monolayer workflows. iPSC = induced pluripotent stem cell.
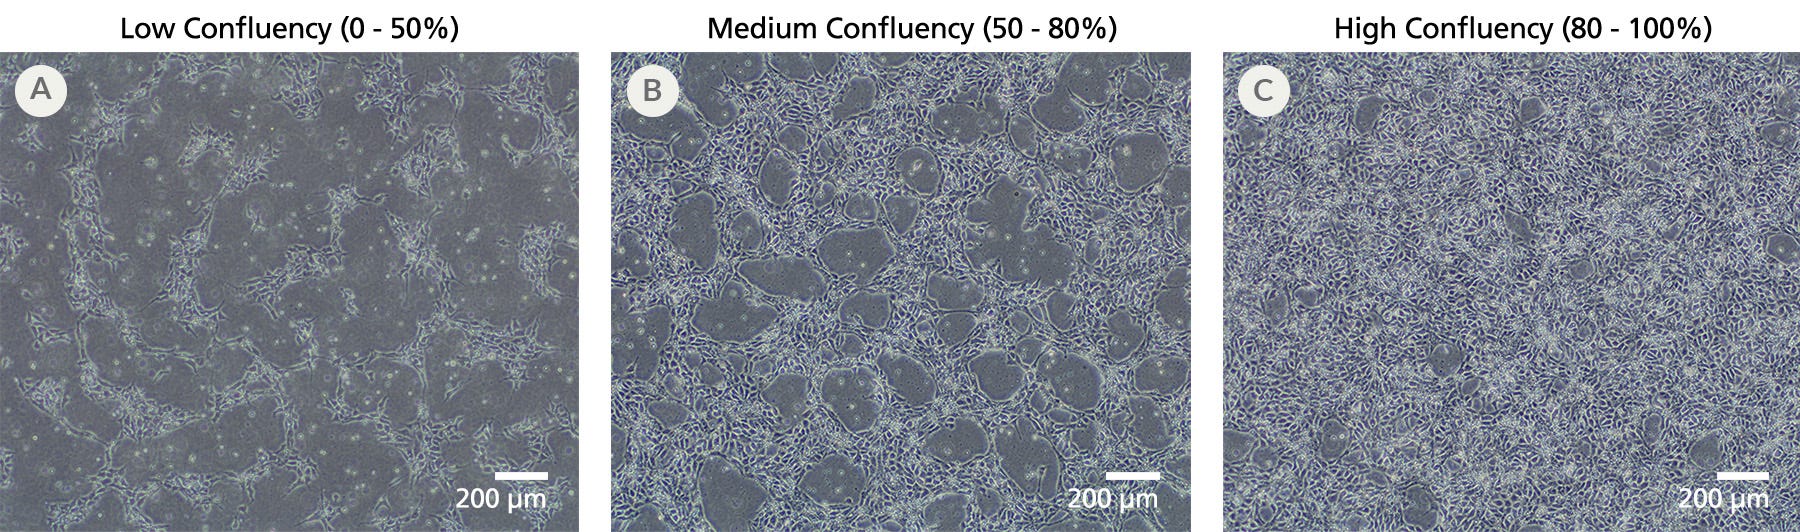
Figure 2. iPSCdirect™ SCTi003-A Cells Can Be Seeded to Reach a Range of Confluencies After 24 Hours
To reach the desired confluency for downstream experiments, thaw and plate iPSCdirect™ cells into mTeSR™ Plus with CloneR™2 (Catalog #100-0276 and #100-0691) at the densities recommended in the Product Information Sheet. These representative examples of (A) low confluency, (B) medium confluency, and (C) high confluency were cultured after thaw on Corning® Matrigel® hESC-Qualified Matrix and imaged at a magnification of 4X.
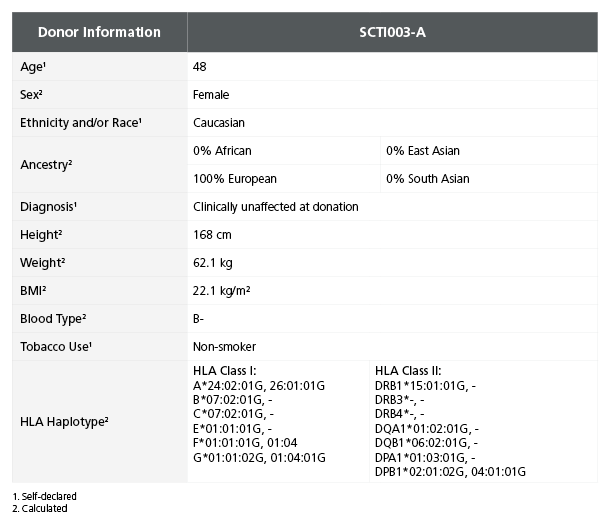
Table 1. iPSC Line SCTi003-A Is Derived from a Healthy Female Donor
Demographic, health, and genetic characteristics of the SCTi003-A donor are compiled based on self-reported information and whole-exome sequencing. Sex was determined by karyotype. Ancestry and HLA haplotype were calculated from whole-genome and whole-exome sequencing combined data. Blood type (ABO/Rh blood group) was determined by next-generation sequencing. Height, weight, and BMI were calculated at the donation facility. iPSC = induced pluripotent stem cell.
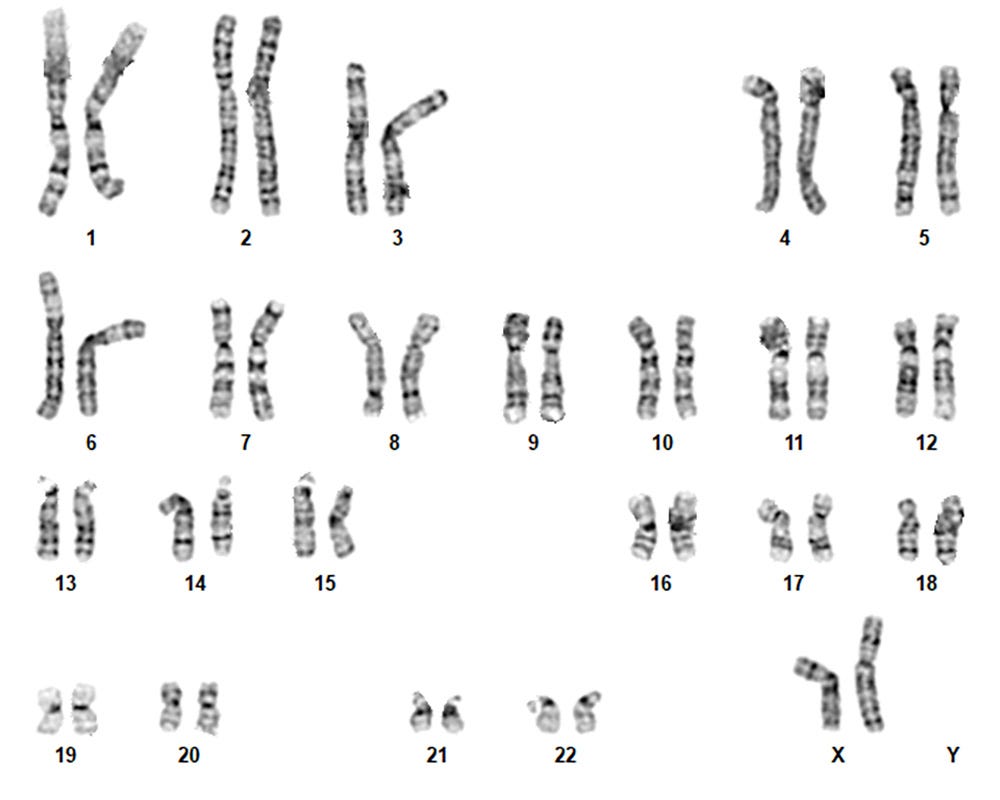
Figure 3. iPSCdirect™ SCTi003-A Human Pluripotent Stem Cells Maintain a Typical Karyotype
G-T-L banding for thawed iPSCdirect™ cells (SCTi003-A p34, n = 40) shows a typical karyotype with no evidence of clonal abnormalities at a band resolution of 425 - 475 G-bands per haploid genome.
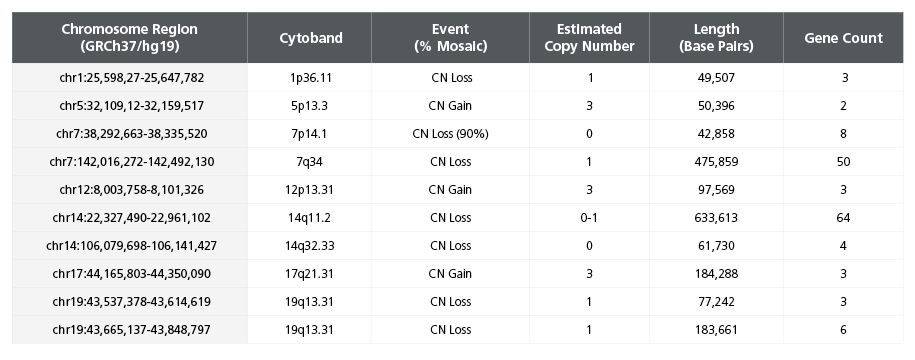
Table 2. Single Nucleotide Polymorphism Microarray Analysis Characterizes SCTi003-A Copy Number Variants
DNA was extracted from a vial of SCTi003-A from the Master Cell Bank and subject to SNP microarray analysis to identify large-scale copy number variants (CNVs). The cells display two reportable CNVs, defined as those greater than 400kb in size, on chromosome 7 and 14 (rows highlighted in bold font). These losses are located in the TCR regions of the genome and are indicative of VDJ recombination process during T Cell development. Array design, genomics position, genes, and chromosome banding are based on genome build GRCh37/hg19. chr = chromosome; start cyto = cytogenetic band at the start of the base pair imbalance; end cyto = cytogenetic band at the end of the base pair imbalance; bp = base pairs; SNP = single nucleotide polymorphism; TCR = T Cell Receptor; VDJ = variable, diversity, joining segment.
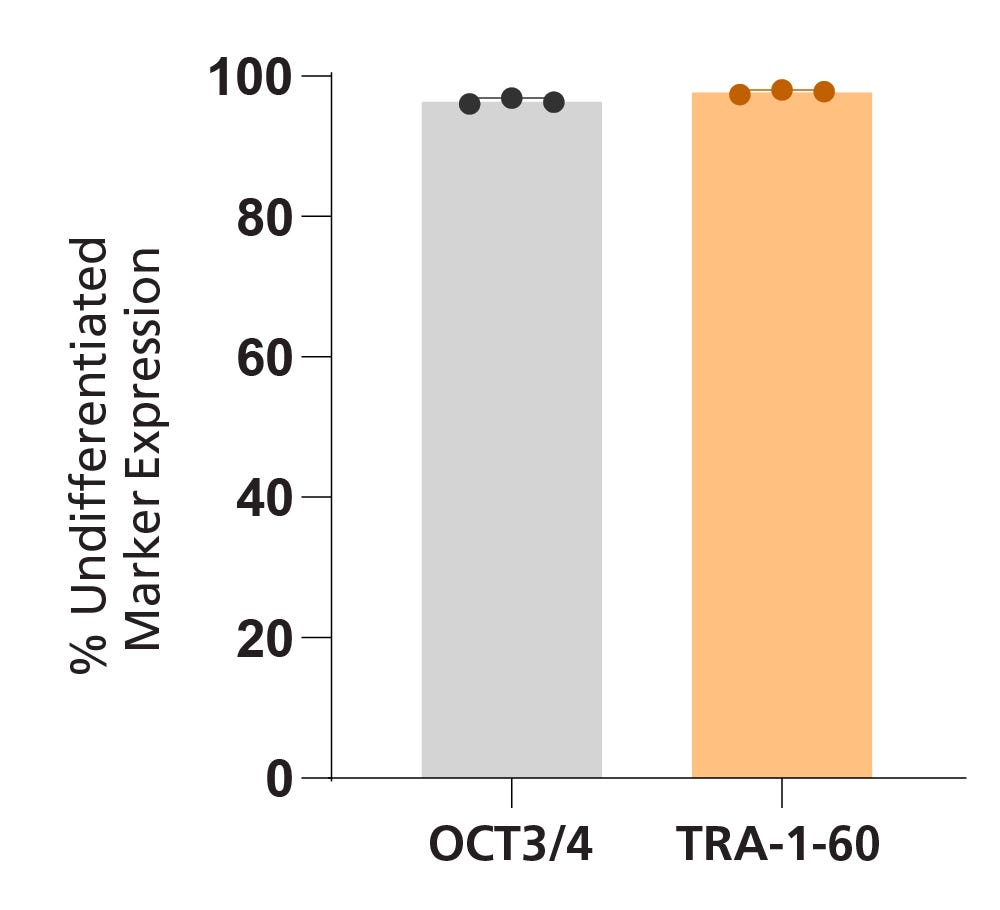
iPSCdirect™ SCTi003-A was characterized using flow cytometry for undifferentiated cell markers OCT3/4 and TRA-1-60. Percentage marker expression was quantified 4 days after thawing, from analyses of three biological replicates (n = 3 vials). Error bars represent the standard deviation.
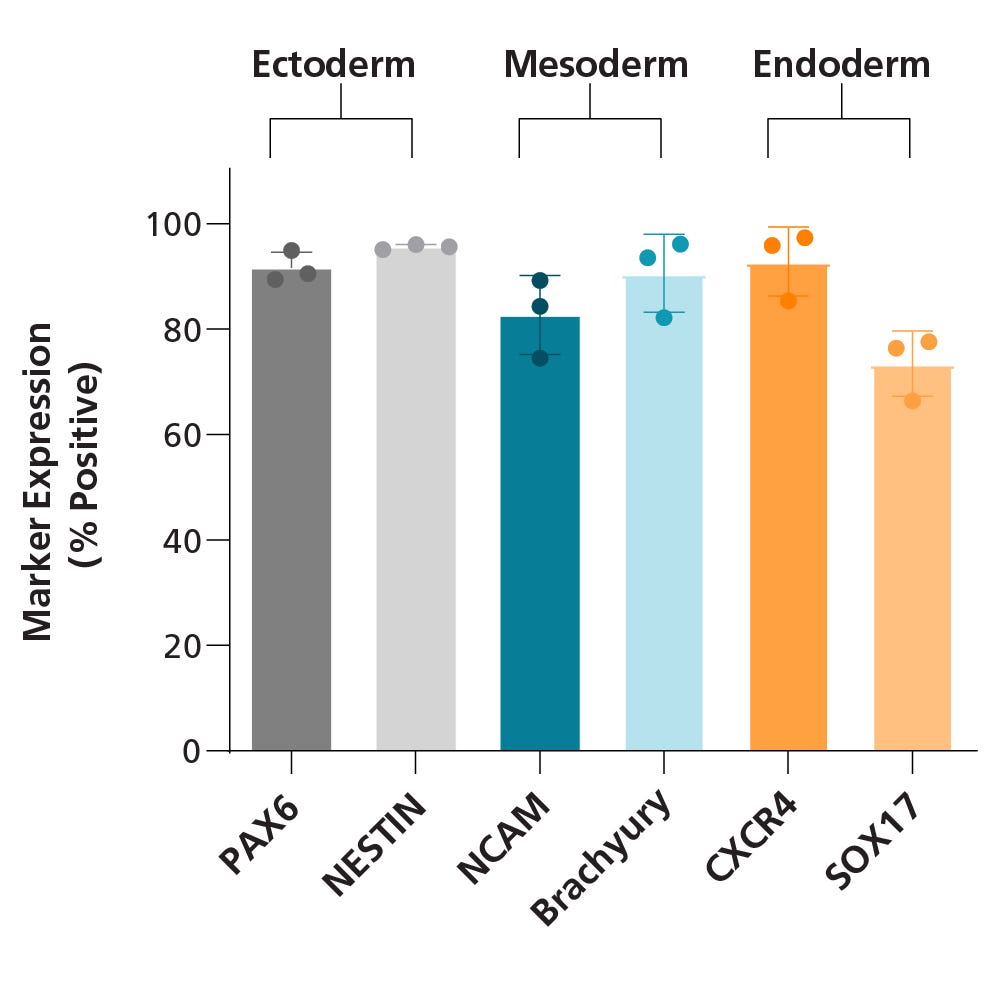
Figure 5. iPSCdirect™ SCTi003-A Human Pluripotent Stem Cells Demonstrate a High Trilineage Differentiation Capacity
iPSCdirect™ SCTi003-A cells were split into 3 groups, differentiated using STEMdiff™ Trilineage Differentiation Kit (Catalog #05230), and then subjected to flow cytometry analysis. Two markers for each embryonic germ layer were assessed, and bars represent mean marker expression for each group of cells (dots represent the average of 3 technical replicates; error bars represent standard deviation; n = 3 biological replicates). All lineage-specific markers were expressed by more than 70% of differentiated cells. Expression of PAX6 and Nestin confirm differentiation to the ectoderm lineage, NCAM and Brachyury (T) expression confirm differentiation to the mesoderm lineage, and CXCR4 and SOX17 expression confirm differentiation to the endoderm lineage.
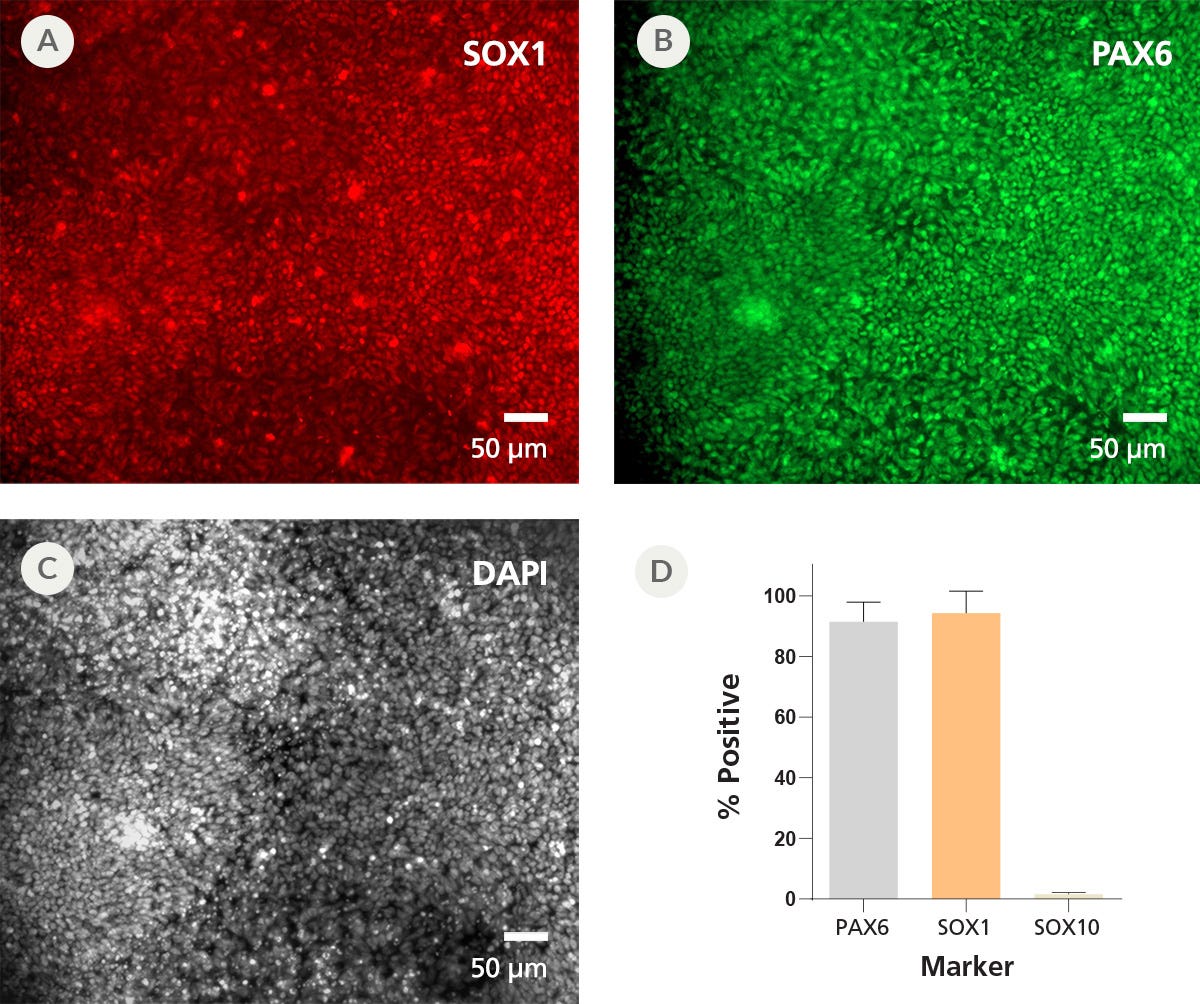
Figure 6. iPSCdirect™ SCTi003-A Human Pluripotent Stem Cells Can Efficiently Differentiate into Neural Progenitor Cells Upon Thawing
NPCs were generated from iPSCdirect™ SCTi003-A cells using the protocol in the iPSCdirect™ Product Information Sheet followed by the monolayer protocol from Day 1 in the STEMdiff™ SMADi Neural Induction Kit Technical Manual (Catalog #08581). After the first 7 days of the protocol, the resulting NPCs were fixed for immunocytochemistry. The NPCs expressed neural progenitor markers (A) SOX1 and (B) PAX6, and nuclei were visualized with (C) DAPI. (D) Marker expression was quantified and negative control SOX10 expression was minimal. Error bars represent standard deviation (n = 2 biological replicates). NPCs = neural progenitor cells.
Figure 7. iPSCdirect™ SCTi003-A Human Pluripotent Stem Cells Can Successfully Differentiate into Ventricular Cardiomyocytes
Ventricular cardiomyocytes were generated from iPSCdirect™ SCTi003-A cells using STEMdiff™ Ventricular Cardiomyocyte Differentiation Kit (Catalog #05010). (A) 48 hours after thawing and plating in mTeSR™ Plus and CloneR™2, iPSCdirect™ cells reached the desired confluency and are ready for Day 0 of differentiation according to the STEMdiff™ Ventricular Cardiomyocyte Product Information Sheet. (B) By Day 15 of differentiation, monolayer cultures show iPSC-derived ventricular cardiomyocytes that (C) exhibit coordinated beating behavior.
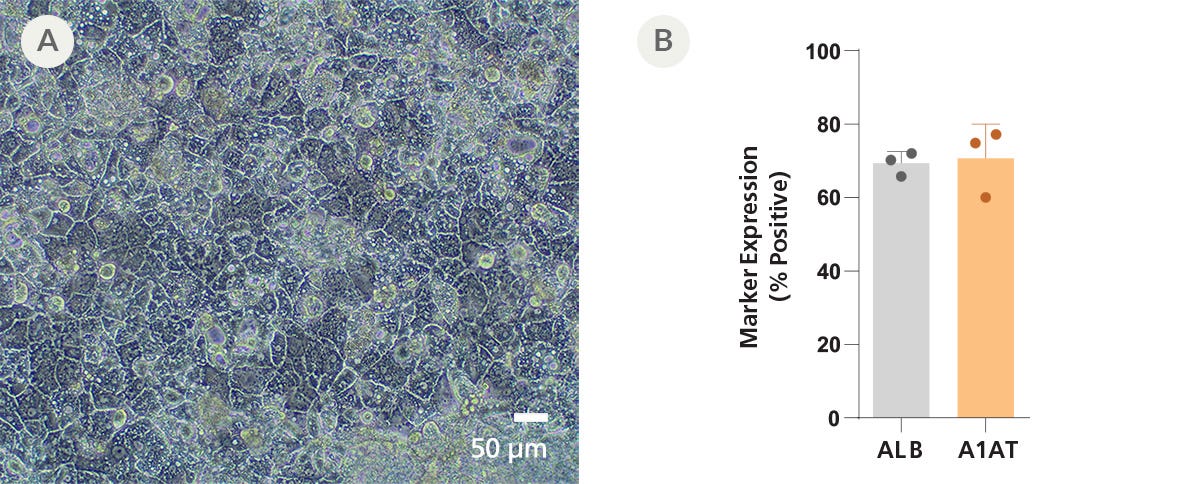
Figure 8. iPSCdirect™ SCTi003-A Human Pluripotent Stem Cells Can Successfully Differentiate into Hepatocytes
iPSCdirect™ SCTi003-A cells were plated according to the iPSCdirect™ Product Information Sheet, in preparation for Day 1 of the STEMdiff™ Hepatocyte Kit (Catalog #100-0520) protocol outlined in the STEMdiff™ Hepatocyte Kit Product Information Sheet. (A) Monolayers of hepatocyte-like cells with characteristic polygonal morphology and binucleation are apparent by Day 21 of differentiation. (B) Marker expression was quantified by flow cytometry for hepatic markers albumin (ALB) and alpha1-antitrypsin (A1AT). Error bars represent standard deviation (n = 3 biological replicates).
This product is designed for use in the following research area(s) as part of the highlighted workflow stage(s). Explore these workflows to learn more about the other products we offer to support each research area.
Thank you for your interest in IntestiCult™ Organoid Growth Medium (Human). Please provide us with your contact information and your local representative will contact you with a customized quote. Where appropriate, they
can also assist you with a(n):
Estimated delivery time for your area
Product sample or exclusive offer
In-lab demonstration
By submitting this form, you are providing your consent to STEMCELL Technologies Canada Inc. and its subsidiaries and affiliates (“STEMCELL”) to collect and use your information, and send you newsletters and emails in accordance with our
privacy policy. Please contact us with any questions that you may have. You can unsubscribe or change your email preferences at any time.
Legal Statement: LIMITED USE LICENSEiPSCdirect™ is a single-use only product. Long-term maintenance or culture of iPSCdirect™ is not permitted. To maintain or expand iPSCdirect™ in the undifferentiated state, end users are required to sign the Standard License Agreement for iPSCs and an annual license fee will apply. Please contact iPSCrequests@stemcell.com for more information.These iPSCs and their modifications (including but not limited to derivatives or differentiated progeny) shall not be used or administered in (1) human subjects for human clinical use; (2) animals for veterinary use for therapeutic, diagnostic, or prophylactic purposes or (3) any subject in relation to, without limiting the generality of the foregoing, clinical applications, cell therapy, transplantation, and/or regenerative medicines, without limiting the generality of the foregoing. These iPSCs and their modifications (including but not limited to derivatives or differentiated progeny) may not be used for monetization or commercialization purposes, including without limitation, used to, or with the goal to, perform services or supply products or rights, including in the manufacture of cellular therapies or other therapeutics, for monetary gain or the generation of royalties, revenues, sales or other valuable consideration. For clarity, these iPSCs and their modifications (including but not limited to derivatives or differentiated progeny) may not be used for screening compounds, antibodies, proteins or peptides, except for the purposes of target discoveryF, target validation, or assay development, provided such activities and the results of such activities are not further used for monetization or commercialization purposes. It may be possible to obtain a further license for the prohibited uses referred to in this Limited Use License. Please contact iPSCrequests@stemcell.com for more details. PRODUCTS ARE FOR RESEARCH USE ONLY AND NOT INTENDED FOR HUMAN OR ANIMAL DIAGNOSTIC OR THERAPEUTIC USES UNLESS OTHERWISE STATED.